Be In Control Of Your Estate

Easily View and Manage Your Properies
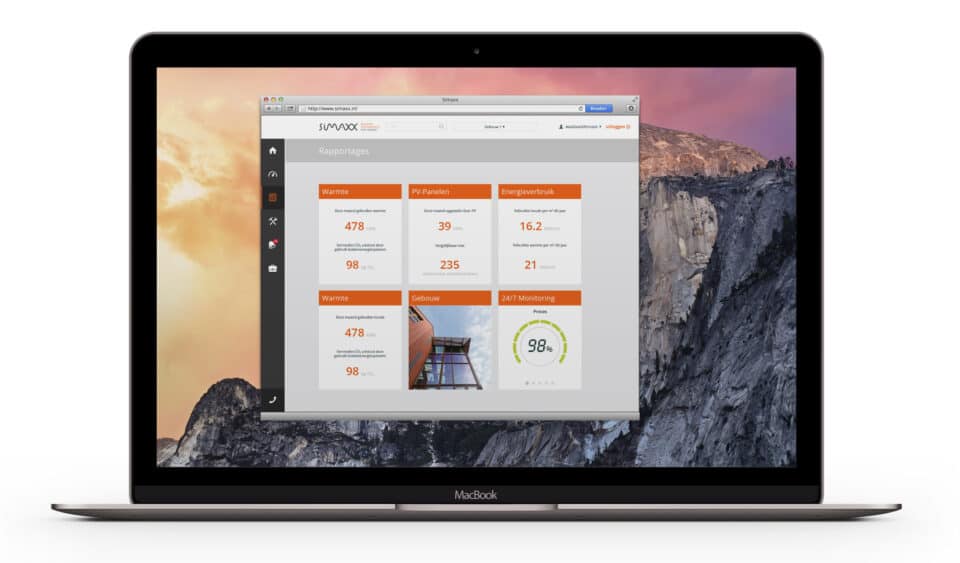
Simple visualisations for Estate Managers to view entire portfolio performance through portfolio management. Colour-coded indications highlight the worse-performing sites. Easy to benchmark sites according to KPIs.
Portfolio Overview – Maps & KPI links
Map overview that provides site locations. Tool Tips indicate site performance, and KPI measurements and provide links to Dashboards and Analysis. From overview to detail in 3 simple clicks.
Portfolio Overview – List view
Filtered lists allow the performance of sites to be compared against other sites in the portfolio. The aggregate KPI scores for each site are shown in list order. Attention can be focused on non-performing sites.
Portfolio Overview – Aggregate Performance
Roll up the performance of sites. Can be used to analyse energy levels and carbon usage across estate.

Build a Picture
Collect data from any system, location, or format with a vast array of integration methods that are quick and easy to use.
Keep It All In One Place
Store all your energy related data in a single unified location. From energy consumption and costs to data about the building envelope and occupancy.
Manage the Data
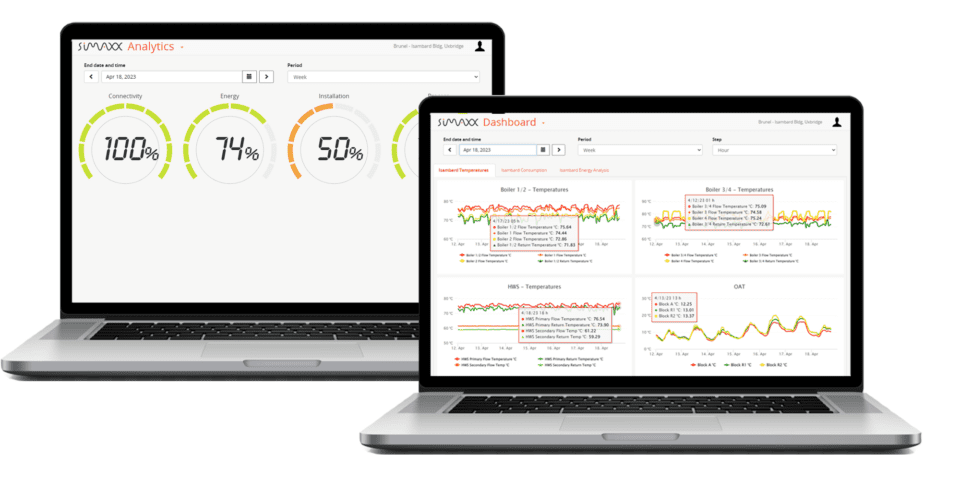
Graphs and visualisations allow key data to be presented clearly with business goals in mind. Data sets are manipulated automatically to show data over time.
Do You Spend More Time Managing Data Than Managing Energy Use?
It’s a truism that ‘If you can’t measure it, you can’t improve it.’ But if the data measured comes from many different places in a myriad of formats, it’s difficult to unify and even harder to trust.
- How do you collate and store data from spreadsheets, BMS systems, IoT devices, smart meters, production systems, and more, in one place to give you an accurate set of data for analysis and insight generation?
- How easy is it to normalise the data to provide the business information you require?
- How compatible is it with existing hardware and Management Information systems?

Be Confident
Create a realistic energy baseline so you can be fully confident in your forecasting and reported savings.
Identify Opportunities
Set up calculations, predictive analysis, visualisations, and outputs to help you achieve your energy saving goals.
Monitor Progress
Track performance over time and against a baseline of usage, cost, or carbon. Monitor progress towards your goals.
Is Your Data Making Sense?
Many companies struggle to analyse energy data in ways that provide useful and actionable insights. It’s hard to make sense of data when you can’t draw out trends, see anomalies, or use benchmark analysis. Most energy consumption analysis runs out of steam with at least one of these problems:
● No way to measure data quality
● Limited options for looking at the data
● Limited choice of graph types
● Too complex to use across the business
● Pretty dashboards, but lack actionable insights
● No option to save templates
● Non-interactive graphs only
Get The Insights You Need With Customised Analysis
Make sense of your data with Simaxx’s sophisticated, targeted, and interactive analyses.
Intelligent Driven Analysis
Simaxx offers a huge array of analytics techniques for management of energy that cater across a wide range of sectors. Interactive analyses enable you to drill down, rollup, monitor humidity, convert to Co2, cost, and more.
Custom Reporting
Access your Simaxx report library, use our dynamic reporting tool to easily build your own reports in-system, or have a report custom built by our team for you.
High Performance
Simaxx works with global organisations and big data sets, processing vast amounts of data in milliseconds. You get the insights you need quickly, no matter how much data you are processing.
Automatic Meter Readings
Simaxx automatically reads consumption data from tenant meters and submeters, so it’s easy to generate error-free invoices.
Automated Bill Creation And Distribution
Easily bill tenants for electricity, steam, natural gas, chilled water, and domestic water usage and generate accurate and professional invoices that display tenant energy consumption with just a few clicks.
Utility Sub-Metering
Track utility use of individual tenants so charges can be applied according to exact consumption. This effective method of utility management helps to provide tenants with a sense of control over their operating expenses.
Anomaly Detection
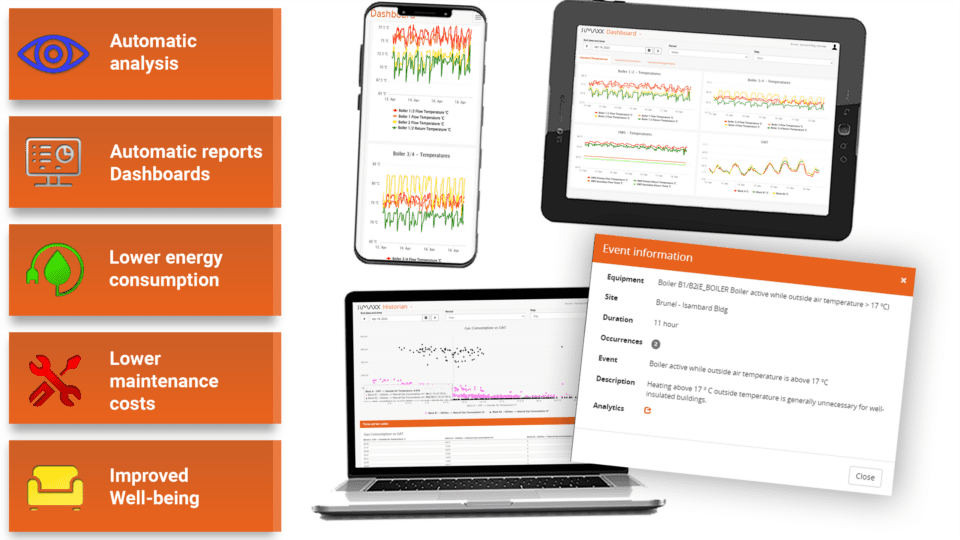
Get notified before it’s too late…. Equipment faults and inefficiencies can lead to increased costs for your business, with expensive assets requiring repair or replacement. When failures do occur, you need to react quickly to prolong equipment life.
Simaxx can detect anomalies – providing an extensive set of alarms that can be configured on-mass to notify of faults, leaks, oversights, and other problems, so you can take corrective action.
Experience Facilities Management without Burdens and Limits
The business costs of maintaining a well-run facility can add up fast if your assets, workforce or contractors are not operating to their full potential. With the automation of data for everyday tasks and easy access to all FM data in one place, you can make informed decisions and ensure that planned and reactive maintenance is completed on time, to budget, and is compliant. Take full control with innovative facilities management software that helps you stay ahead of the curve.
